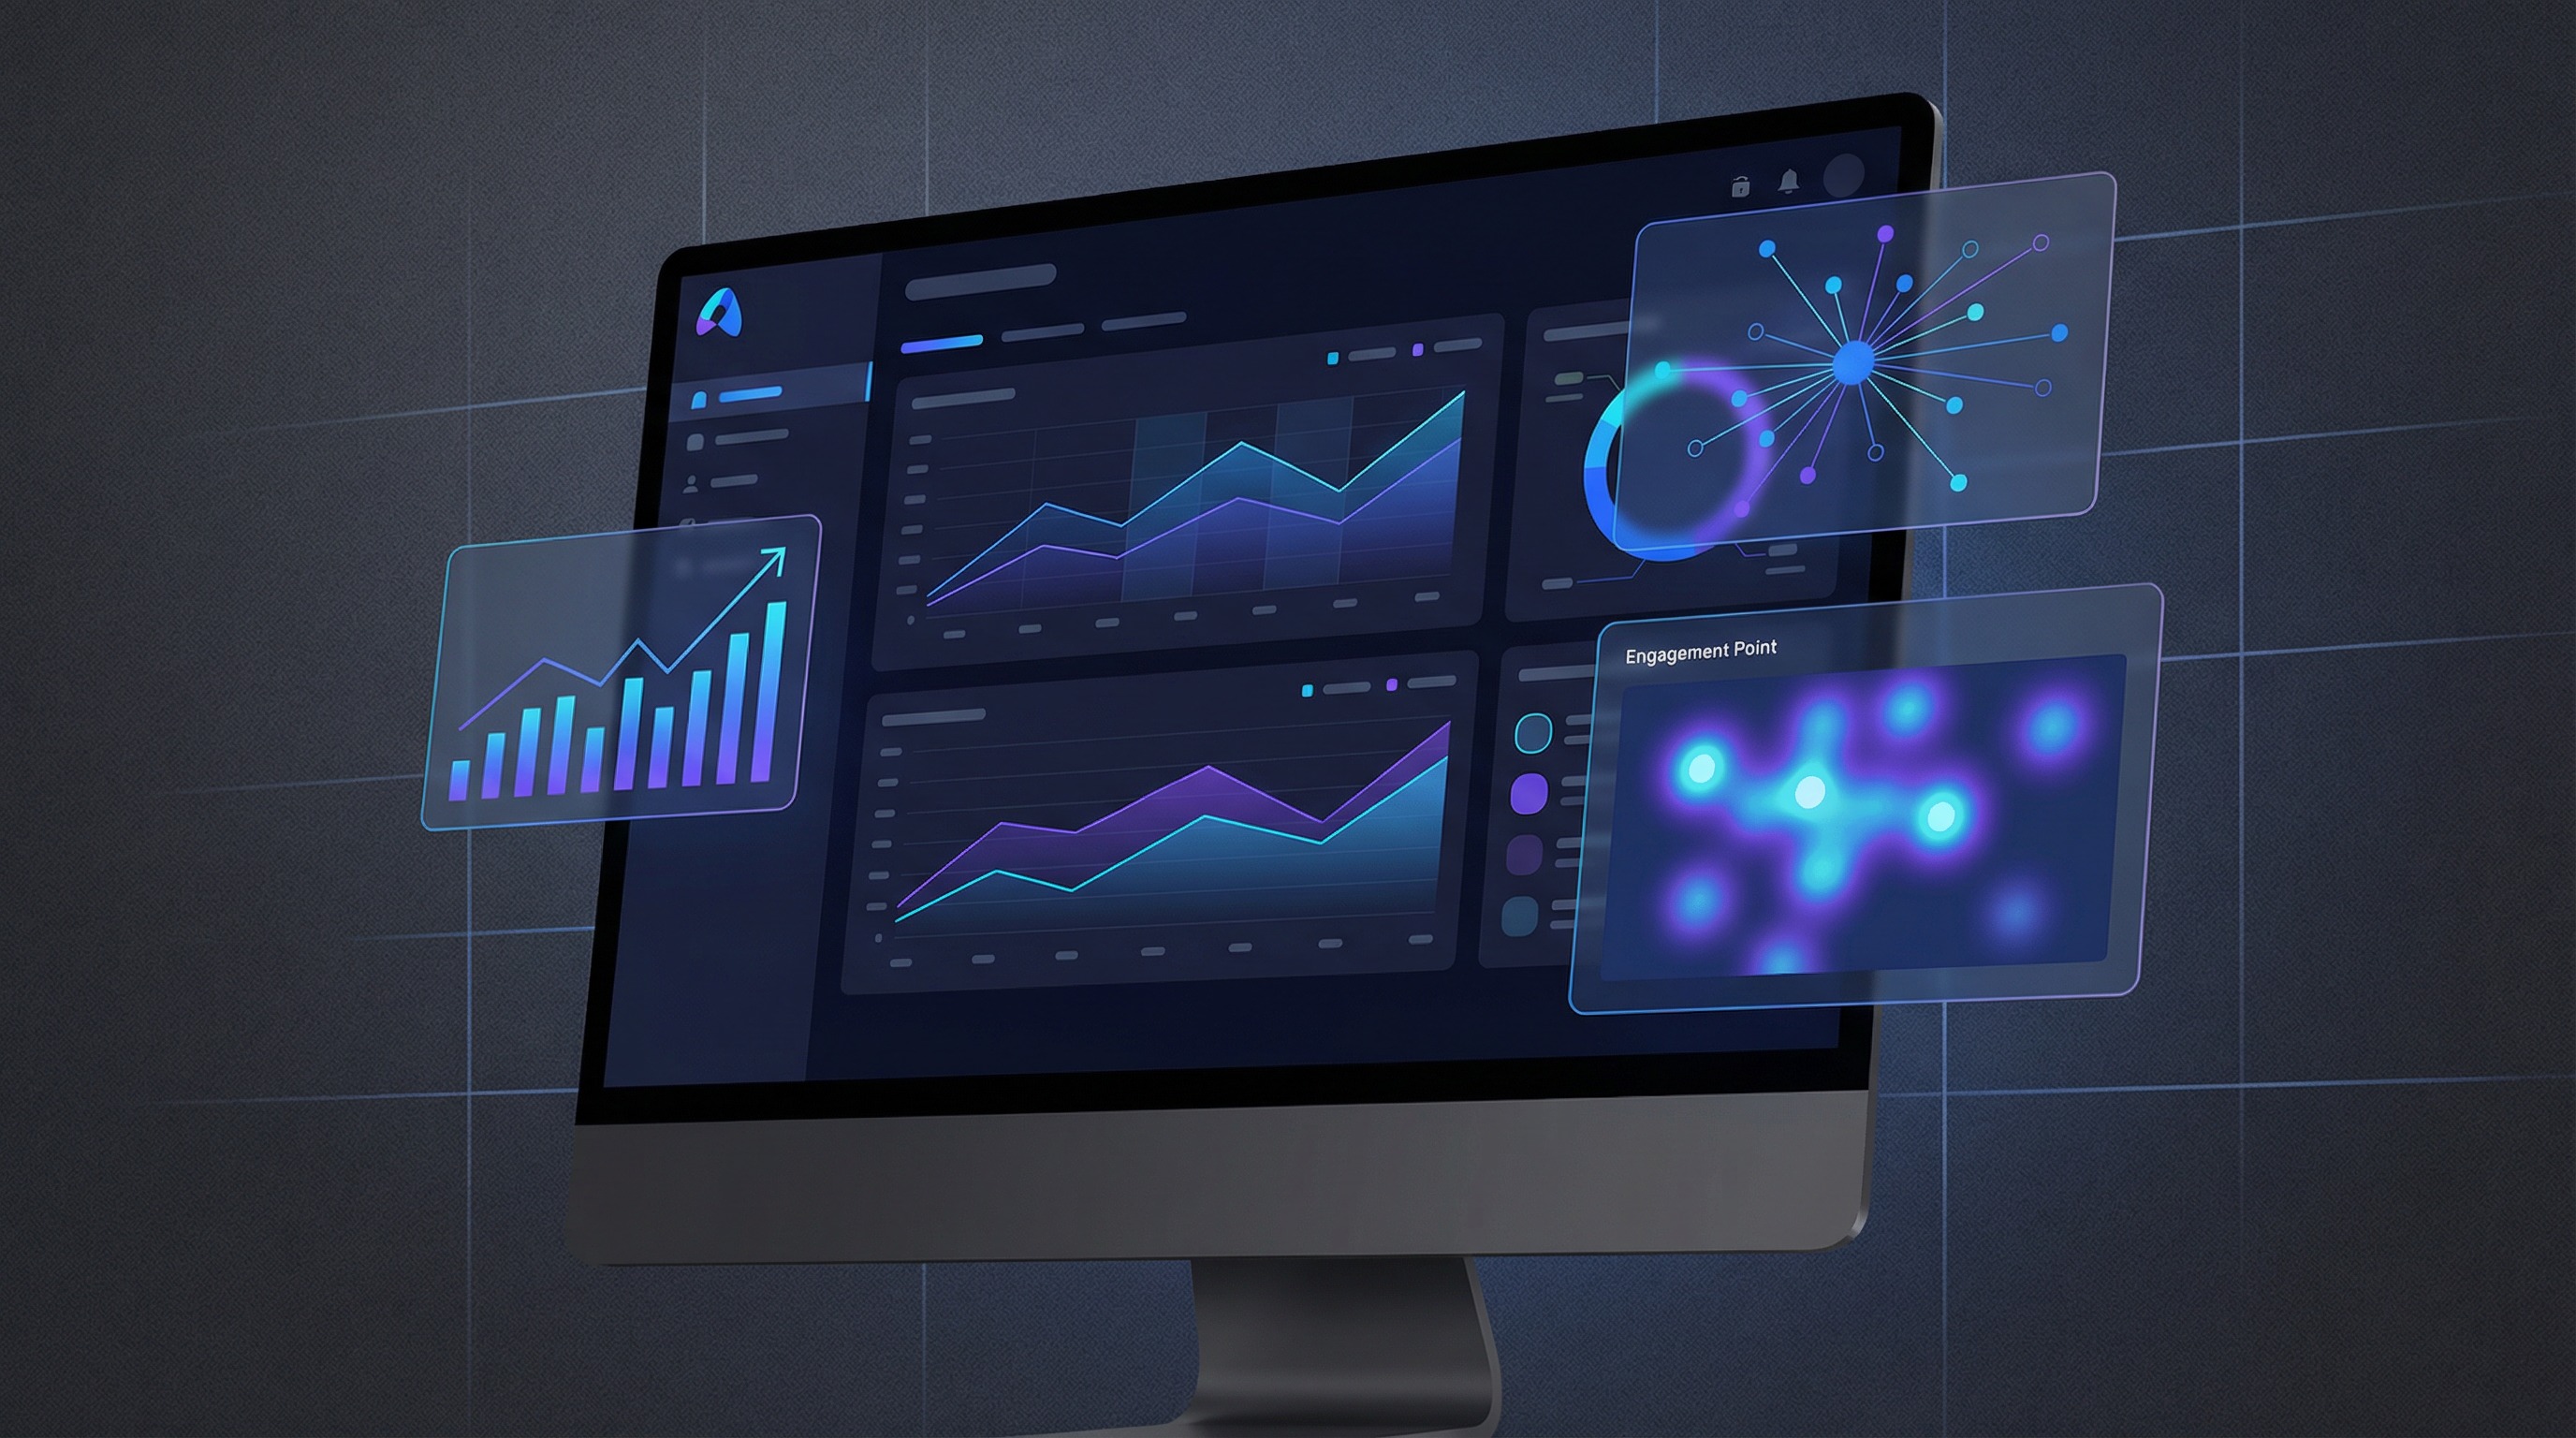
Real-Time Analytics Reports: Know Your Business at a Glance
[!TIP]
TL;DR — Your Account Concierge now has five analytics reports you can pull with a simple ask: Lead Flow, Communication Volume, Engagement, CRM Activity, and Deal Pipeline. Each returns in under a second.
Your Oppy Account Concierge just got a whole lot smarter. We’ve added five powerful analytics reports that give you instant visibility into what’s happening across your leads, communications, engagement, team activity, and deal pipeline — all available with a simple ask.
No dashboards to configure. No spreadsheets to export. Just ask your concierge and get the answers in seconds.
What’s New
Your Account Concierge can now pull real-time analytics reports from your event stream. Every action in your account — new leads, messages sent, emails opened, deals created — is tracked as an event. These reports aggregate that data into clear, actionable summaries with trend analysis built in.
Every report automatically compares your current period to the prior period, so you always know if things are trending up or down.
The Five Reports

1. Lead Flow
“Show me my lead flow report”
See exactly how many new leads are coming in and whether your pipeline is growing or shrinking.
| What’s tracked | Description |
| New CRM contacts | People created in your CRM |
| New Oppy contacts | Contacts created directly in Oppy |
| Integration syncs | Leads arriving via Follow Up Boss and other integrations |
You’ll see: Total new leads, daily trend (last 14 days), breakdown by source, and % change vs. prior period.
[!NOTE]
Great for answering: “Are we getting more leads this month than last?”

2. Communication Volume
“How’s our communication volume looking?”
Get a full breakdown of outreach across every channel.
| Channel | What’s counted |
| SMS | Text messages sent |
| Emails delivered | |
| Calls | Phone calls placed |
| Oppy Messages | All messages delivered by your Oppy assistants |
You’ll see: Total communications, per-channel breakdown with individual % changes, and daily volume trend.
[!NOTE]
Great for answering: “Which channel is driving the most conversations?”

3. Engagement
“Pull up engagement stats”
Understand how your contacts are responding to outreach.
| Metric | Description |
| Email opens | How many emails were opened |
| Link clicks | How many links were clicked |
| Click-to-open rate | Clicks / opens — measures content effectiveness |
| Hot lead alerts | Contacts tagged RETURNED or PRIORITY in your CRM |
| Unsubscribes | Contacts who opted out |
You’ll see: Email engagement metrics, hot lead signal count, daily opens trend, and prior period comparison.
[!IMPORTANT]
Hot lead alerts surface contacts who are actively re-engaging — these are your highest-intent prospects.

4. CRM Activity
“What does CRM activity look like this month?”
Monitor team productivity at a glance.
| Activity | What’s counted |
| Notes | Notes added to contacts |
| Tasks | Tasks created and assigned |
| Events | CRM events logged |
| Calls | Calls logged in the CRM |
| Appointments | Appointments scheduled |
You’ll see: Total CRM actions, breakdown by activity type, daily trend, and % change vs. prior period.
[!NOTE]
Great for answering: “Is the team staying active in the CRM?”

5. Deal Pipeline
“Show me the deal pipeline report”
Track pipeline health and appointment conversion.
| Metric | Description |
| New deals | Deals opened this period |
| Deal updates | Progress and stage changes |
| New appointments | Appointments booked |
| Appointment updates | Modifications to scheduled appointments |
| Cancel rate | Cancellations / new appointments — measures stickiness |
You’ll see: Deal and appointment volumes, cancellation rate, daily new deals trend, and prior period comparison.
[!WARNING]
A cancel rate above 20% may indicate qualification or scheduling issues worth investigating.
Custom Date Ranges
Reports default to the last 30 days, automatically compared to the 30 days before. You can customize the window by specifying dates:
| Example ask | What you get |
| “Lead flow for March” | March 1 - April 1 vs. February |
| “Communication volume last 7 days” | Last 7 days vs. prior 7 days |
| “Engagement since January 1” | Jan 1 to today vs. equivalent prior period |
Performance
Reports are optimized for speed each report returns in under a second, even on accounts with millions of events.
Get Started
These reports are available right now in your Account Concierge. Open the concierge chat and ask for any report by name. No setup required — if your account has event data, the reports are ready to go.
[!TIP]
Try it now: open your Account Concierge and type “Show me my lead flow report”